Arrow Financial (AROW): Reducing The Earnings Estimate And Downgrading To Hold

Photo Italia LLC
Earnings of Arrow Financial Corporation (NASDAQ:AROW) will likely remain flattish this year as the growth of operating expenses will counter the effect of the growth of the net interest margin and the loan balance. I’m expecting the company to report earnings of $2.97 per share for 2023, up by just 1{d0229a57248bc83f80dcf53d285ae037b39e8d57980e4e23347103bb2289e3f9} year-over-year. Compared to my last report on the company, I’ve reduced my earnings estimate mostly because I’ve decreased my net interest margin estimate. The year-end target price suggests a small upside from the current market price. Based on the total expected return, I’m downgrading Arrow Financial Corporation to a hold rating.
Reducing the Margin Estimate
After growing by 12 basis points in each of the second and third quarters, the margin contracted by 6 basis points during the fourth quarter of 2022. Due to this change, the margin missed the estimate given in my last report on the company.
The management slightly improved the deposit mix over the fourth quarter. Interest-bearing demand and savings accounts dipped to 70.1{d0229a57248bc83f80dcf53d285ae037b39e8d57980e4e23347103bb2289e3f9} by the end of December 2022 from 71.1{d0229a57248bc83f80dcf53d285ae037b39e8d57980e4e23347103bb2289e3f9} at the end of September 2022. This improvement will make the average deposit cost a bit less rate sensitive going forward. Nevertheless, the proportion of adjustable-rate deposits (interest-bearing demand and savings) is still very high at around 70{d0229a57248bc83f80dcf53d285ae037b39e8d57980e4e23347103bb2289e3f9}.
I’m expecting the Federal Reserve to increase the fed funds rate by a further 50 basis points till the middle of 2023 and then hold it constant. Therefore, the quick deposit repricing will keep the margin under pressure during the first half of the year. However, the margin’s trend will likely reverse in the second half of the year as the bulk of the deposit repricing will end soon after the last rate hike, but the loan repricing will continue.
Considering these factors, I’m expecting the margin to remain stable in the first half and then grow by 20 basis points in the second half of 2023. Compared to my last report on the company, I’ve reduced my average margin estimate for 2023 because of the last quarter’s negative surprise. Further, I’m now expecting the margin’s expansion phase to start later this year than I previously expected.
Loan Growth Likely to be Near the Historical Average
Arrow Financial Corporation’s loan growth dropped close to the historical average in the fourth quarter of the year after reporting above-average growth for the first nine months of 2022. The portfolio grew by 2{d0229a57248bc83f80dcf53d285ae037b39e8d57980e4e23347103bb2289e3f9} during the quarter, or 8{d0229a57248bc83f80dcf53d285ae037b39e8d57980e4e23347103bb2289e3f9} annualized, taking full-year growth to 11.8{d0229a57248bc83f80dcf53d285ae037b39e8d57980e4e23347103bb2289e3f9}. This performance was in line with my expectations.
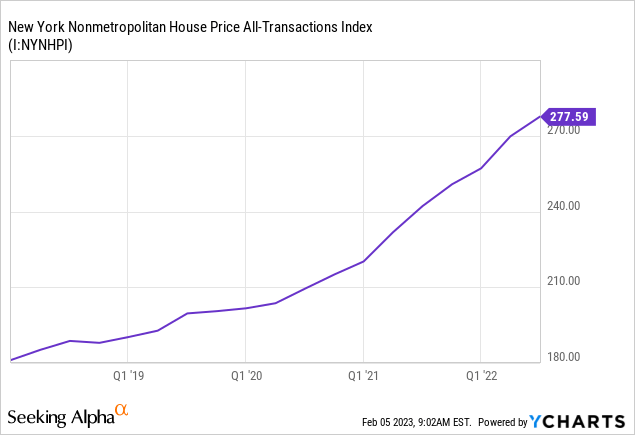
In my opinion, loan growth will remain at the fourth quarter’s level throughout 2023 because of conflicting economic factors. Headquartered in Glen Falls, New York, Arrow Financial mostly operates in the state of New York. Additionally, the company has a large residential loan book, which made up 36{d0229a57248bc83f80dcf53d285ae037b39e8d57980e4e23347103bb2289e3f9} of total loans at the end of December 2022. As a result, the health of New York’s housing market is an important indicator of product demand. As shown below, the curve of the house price index has recently flattened, but it is still very high from a historical perspective.

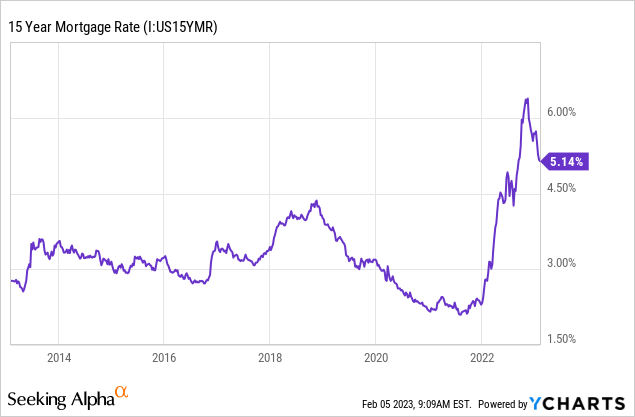
Moreover, the high mortgage rates will continue to pressurize the demand for residential loans.

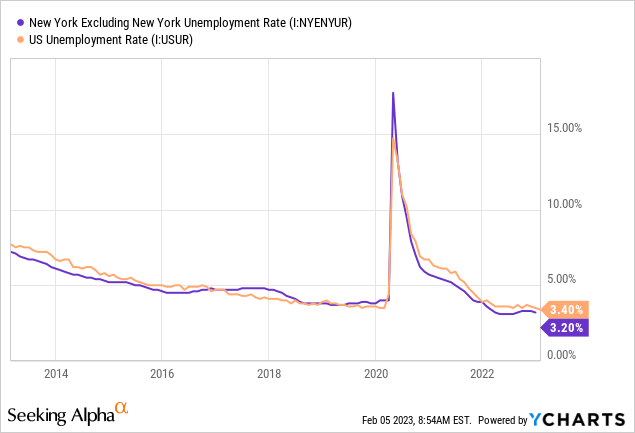
The outlook for commercial loans is better as it is not heavily dependent on interest rates. This is because in many cases, businesses have the option of passing on the impact of higher borrowing costs to the end customers through price hikes. Further, the unemployment rate of New York, excluding New York City, is currently very low when compared to its history as well as the national average. Due to the strong job market, the credit demand can be expected to remain healthy in the near term.

Considering these conflicting factors, I’m expecting the loan portfolio to grow by 8{d0229a57248bc83f80dcf53d285ae037b39e8d57980e4e23347103bb2289e3f9} in 2023. Further, I’m expecting other balance sheet items to grow somewhat in line with loans. The following table shows my balance sheet estimates.
| Financial Position | FY18 | FY19 | FY20 | FY21 | FY22 | FY23E |
| Net Loans | 2,176 | 2,365 | 2,566 | 2,641 | 2,953 | 3,197 |
| Growth of Net Loans | 12.6{d0229a57248bc83f80dcf53d285ae037b39e8d57980e4e23347103bb2289e3f9} | 8.7{d0229a57248bc83f80dcf53d285ae037b39e8d57980e4e23347103bb2289e3f9} | 8.5{d0229a57248bc83f80dcf53d285ae037b39e8d57980e4e23347103bb2289e3f9} | 2.9{d0229a57248bc83f80dcf53d285ae037b39e8d57980e4e23347103bb2289e3f9} | 11.8{d0229a57248bc83f80dcf53d285ae037b39e8d57980e4e23347103bb2289e3f9} | 8.2{d0229a57248bc83f80dcf53d285ae037b39e8d57980e4e23347103bb2289e3f9} |
| Other Earning Assets | 646 | 638 | 930 | 1,194 | 790 | 822 |
| Deposits | 2,346 | 2,616 | 3,235 | 3,550 | 3,498 | 3,787 |
| Borrowings and Sub-Debt | 354 | 231 | 88 | 70 | 80 | 83 |
| Common equity | 270 | 302 | 334 | 371 | 354 | 355 |
| Book Value Per Share ($) | 18.1 | 20.1 | 21.6 | 23.1 | 21.3 | 21.4 |
| Tangible BVPS ($) | 16.5 | 18.6 | 20.1 | 21.6 | 19.9 | 20.0 |
| Source: SEC Filings, Author’s Estimates(In USD million unless otherwise specified) | ||||||
Expecting Flattish Earnings
The anticipated loan growth and margin expansion will likely lift earnings. On the other hand, inflation will drive up operating expenses, which will restrict earnings growth. I’m expecting the efficiency ratio (calculated as non-interest expenses divided by total revenues) to rise to 55.8{d0229a57248bc83f80dcf53d285ae037b39e8d57980e4e23347103bb2289e3f9} in 2023 from 54.6{d0229a57248bc83f80dcf53d285ae037b39e8d57980e4e23347103bb2289e3f9} in 2022. Meanwhile, I’m expecting the provisioning for expected loan losses to remain near the historical average. I’m expecting the net provision expense to make up 0.16{d0229a57248bc83f80dcf53d285ae037b39e8d57980e4e23347103bb2289e3f9} of total loans in 2023, which is close to the average for the last five years.
Overall, I’m expecting Arrow Financial to report earnings of $2.97 per share for 2023, up by just 1{d0229a57248bc83f80dcf53d285ae037b39e8d57980e4e23347103bb2289e3f9}. The following table shows my income statement estimates.
| Income Statement | FY18 | FY19 | FY20 | FY21 | FY22 | FY23E |
| Net interest income | 84 | 88 | 99 | 110 | 118 | 124 |
| Provision for loan losses | 3 | 2 | 9 | 0 | 5 | 5 |
| Non-interest income | 29 | 29 | 33 | 32 | 31 | 30 |
| Non-interest expense | 65 | 67 | 71 | 78 | 82 | 86 |
| Net income – Common Sh. | 36 | 37 | 41 | 50 | 49 | 49 |
| EPS – Diluted ($) | 2.43 | 2.50 | 2.64 | 3.10 | 2.95 | 2.97 |
| Source: SEC Filings, Author’s Estimates(In USD million unless otherwise specified) | ||||||
In my last report on Arrow Financial, I estimated earnings of $3.30 per share for 2023. I’ve reduced my earnings estimate mostly because I’ve decreased my margin estimate.
My estimates are based on certain macroeconomic assumptions that may not come to fruition. Therefore, actual earnings can differ materially from my estimates.
Downgrading to a Hold Rating
Arrow Financial is offering a dividend yield of 3.3{d0229a57248bc83f80dcf53d285ae037b39e8d57980e4e23347103bb2289e3f9} at the current quarterly dividend rate of $0.27 per share. The earnings and dividend estimates suggest a payout ratio of 36{d0229a57248bc83f80dcf53d285ae037b39e8d57980e4e23347103bb2289e3f9} for 2023, which is in line with the five-year average of 39{d0229a57248bc83f80dcf53d285ae037b39e8d57980e4e23347103bb2289e3f9}. Therefore, I’m not expecting an increase in the dividend level.
I’m using the historical price-to-tangible book (“P/TB”) and price-to-earnings (“P/E”) multiples to value Arrow Financial. The stock has traded at an average P/TB ratio of 1.67x in the past, as shown below.
| FY18 | FY19 | FY20 | FY21 | FY22 | Average | |
| T. Book Value per Share ($) | 16.5 | 18.6 | 20.1 | 21.6 | 19.9 | |
| Average Market Price ($) | 33.0 | 32.3 | 28.5 | 33.9 | 32.5 | |
| Historical P/TB | 2.00x | 1.74x | 1.42x | 1.57x | 1.63x | 1.67x |
| Source: Company Financials, Yahoo Finance, Author’s Estimates | ||||||
Multiplying the average P/TB multiple with the forecast tangible book value per share of $20.0 gives a target price of $33.5 for the end of 2023. This price target implies a 3.2{d0229a57248bc83f80dcf53d285ae037b39e8d57980e4e23347103bb2289e3f9} upside from the February 3 closing price. The following table shows the sensitivity of the target price to the P/TB ratio.
| P/TB Multiple | 1.47x | 1.57x | 1.67x | 1.77x | 1.87x |
| TBVPS – Dec 2023 ($) | 20.0 | 20.0 | 20.0 | 20.0 | 20.0 |
| Target Price ($) | 29.5 | 31.5 | 33.5 | 35.5 | 37.5 |
| Market Price ($) | 32.4 | 32.4 | 32.4 | 32.4 | 32.4 |
| Upside/(Downside) | (9.1){d0229a57248bc83f80dcf53d285ae037b39e8d57980e4e23347103bb2289e3f9} | (2.9){d0229a57248bc83f80dcf53d285ae037b39e8d57980e4e23347103bb2289e3f9} | 3.2{d0229a57248bc83f80dcf53d285ae037b39e8d57980e4e23347103bb2289e3f9} | 9.4{d0229a57248bc83f80dcf53d285ae037b39e8d57980e4e23347103bb2289e3f9} | 15.6{d0229a57248bc83f80dcf53d285ae037b39e8d57980e4e23347103bb2289e3f9} |
| Source: Author’s Estimates |
The stock has traded at an average P/E ratio of around 11.8x in the past, as shown below.
| FY18 | FY19 | FY20 | FY21 | FY22 | Average | |
| Earnings per Share ($) | 2.43 | 2.50 | 2.64 | 3.10 | 2.95 | |
| Average Market Price ($) | 33.0 | 32.3 | 28.5 | 33.9 | 32.5 | |
| Historical P/E | 13.6x | 12.9x | 10.8x | 10.9x | 11.0x | 11.8x |
| Source: Company Financials, Yahoo Finance, Author’s Estimates | ||||||
Multiplying the average P/E multiple with the forecast earnings per share of $2.97 gives a target price of $35.2 for the end of 2023. This price target implies an 8.7{d0229a57248bc83f80dcf53d285ae037b39e8d57980e4e23347103bb2289e3f9} upside from the February 3 closing price. The following table shows the sensitivity of the target price to the P/E ratio.
| P/E Multiple | 9.8x | 10.8x | 11.8x | 12.8x | 13.8x |
| EPS 2023 ($) | 2.97 | 2.97 | 2.97 | 2.97 | 2.97 |
| Target Price ($) | 29.3 | 32.2 | 35.2 | 38.2 | 41.2 |
| Market Price ($) | 32.4 | 32.4 | 32.4 | 32.4 | 32.4 |
| Upside/(Downside) | (9.7){d0229a57248bc83f80dcf53d285ae037b39e8d57980e4e23347103bb2289e3f9} | (0.5){d0229a57248bc83f80dcf53d285ae037b39e8d57980e4e23347103bb2289e3f9} | 8.7{d0229a57248bc83f80dcf53d285ae037b39e8d57980e4e23347103bb2289e3f9} | 17.9{d0229a57248bc83f80dcf53d285ae037b39e8d57980e4e23347103bb2289e3f9} | 27.0{d0229a57248bc83f80dcf53d285ae037b39e8d57980e4e23347103bb2289e3f9} |
| Source: Author’s Estimates |
Equally weighting the target prices from the two valuation methods gives a combined target price of $34.3, which implies a 6.0{d0229a57248bc83f80dcf53d285ae037b39e8d57980e4e23347103bb2289e3f9} upside from the current market price. Adding the forward dividend yield gives a total expected return of 9.3{d0229a57248bc83f80dcf53d285ae037b39e8d57980e4e23347103bb2289e3f9}. In my last report, I adopted a buy rating on Arrow Financial with a target price of $38.1 per share. As I’ve reduced my earnings estimate, my target price for the end of the year has also declined. Based on the updated total expected return, I’m downgrading Arrow Financial to a hold rating.
